Google Analytics is a valuable tool that any marketer can use to optimize their content, website and overall campaigns, but there are still some pitfalls to the greatest free analytics tool on the web.
There are two main ways your GA data can actually mislead you:
(1) the metrics themselves have flaws and
(2) the way you think about the metric is flawed.
Here are 7 common metrics that you’re probably doing wrong.
Site Speed
Site speed is an important metric for optimizing user experience, however most marketers don’t have an accurate idea about their site’s speed because of the way it’s measured.
By default, GA measures site speed by sampling the loading time for 1% of your visitors. That’s a really small sample size, which increases the chances of outliers giving you inaccurate data. Luckily, you can fix this.
You can add a code in GA to increase your sample size to 100%. In the “Admin” section of your property, click “Tracking Info” and then “Tracking Code.” You’ll find a code like this:
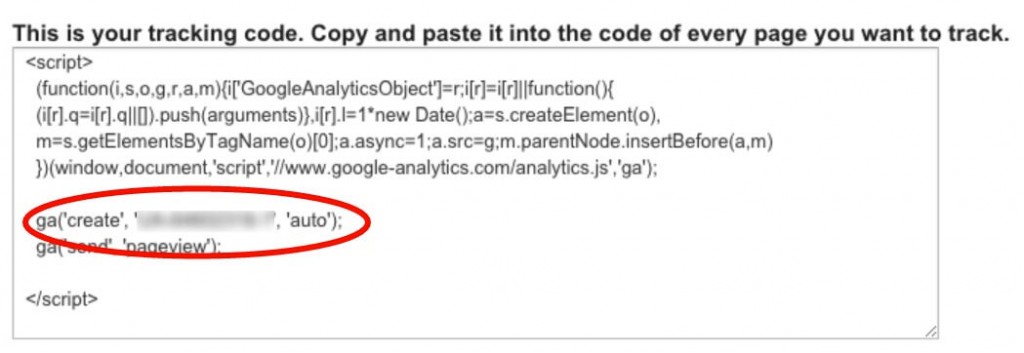
Change the script to this:
ga(‘create’, ‘[YOUR GA ID]‘,{‘siteSpeedSampleRate’: 100});
Save your changes and you’re good to go!
Some metrics like site speed are designed with very high-traffic sites in mind. To avoid GA sampling too few of your visitors, it’s important to adjust these metrics to suit your unique needs.
Bounce Rate
Most marketers think a high bounce rate is always a negative thing — it means that someone came to your site, didn’t like what they saw, and left. But that’s not always or even often the case.
Have you ever read an interesting blog post, got something out of it, and then left the page? I do it about ten times a day. There’s nothing wrong with that kind of website interaction for the marketer, but GA tags it as a bounce.
That person who read your blog post then left could be heading over to follow you on social media, or return to become a longtime customer later on. While very high bounce rates overall is a sign of something negative, there is a certain amount of it that is acceptable.
So instead of stressing over the bounce rate of every page on your site, consider the purpose of the content, and how you might expect your audience to react to it. Sometimes, there’s nothing wrong with reading and then moving on.
Exit Rate
Like bounce rate, exit rate is another metric that marketers tend to think about only in the negative, when that’s not always the case. For example, a page with content that’s designed to convert, and does so effectively, would have a high exit rate. A page with a high SERP rank for long tail keywords would also have a higher exit rate than others. That doesn’t mean it wasn’t valuable.
That’s why it’s important to consider your intent and the search position of the page when deciding if a high exit rate is good or bad.
Conversion Rate by Channel
GA calculates conversion rate by acquisition channel based on the last non-direct click. That’s the best they can do to determine what influenced the conversion. But sometimes, users return to the site as direct traffic, which isn’t taken into consideration. Because of this, the metric often underestimates the actual conversion rate by different channels.
Considering multi-channel funnels and attribution modeling reports in addition to conversion rate by channel will give you a much clearer picture.
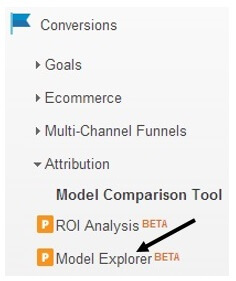
You can find the model explorer tool under Conversions>Attribution in the menu:
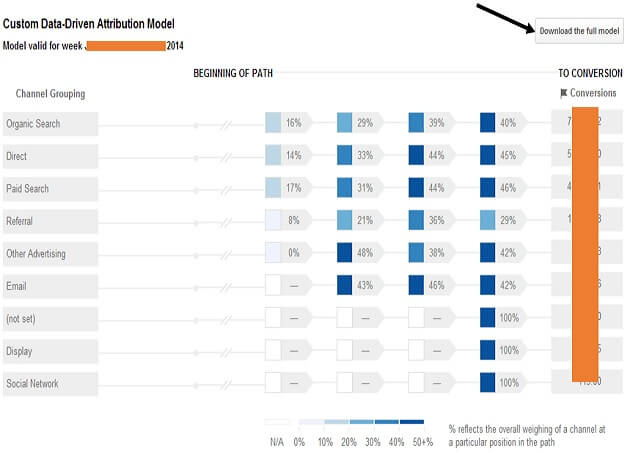
This sample attribution model from Optimize Smart shows the channels for organic search.
Average Time on Page
Many marketers take average time on page to mean how much time visitors are actively consuming content. But GA’s measurement gives the metric a completely different meaning.
Average time on page measures how long your web page is open in the user’s browser. However GA can’t tell if the visitor has multiple tabs open, and is perusing a site in one tab while yours is open in another.
After 30 minutes of not looking at your page, the analytics will “time out.” But still, looking through a few pages of your site for a minute and then leaving the tab open while surfing elsewhere is not a very accurate measurement of user behavior. On top of that, GA is unable to include how much time someone spent on the last page they visited, because another pageview doesn’t follow.
At this point, there’s not much you can do to improve the accuracy of this metric, so just keep in mind that it will almost always be an overestimation of actual behavior.
New and Returning Visitors
New and returning visitors can also be a very misleading metric. That’s because GA tracks returning users with cookies, so any return visitor who deleted their browser history would be considered a new visitor. Also people accessing the same website from different devices (laptop, mobile, tablet) and would be counted as a new visitor each time.
Many consider a low number of returning visitors to be bad for retention. That is valid, but it’s important to remember that a large number of those new visitors are probably not new at all. Also, it’s possible that your website is so well-targeted that users buy your product or service on the first visit, never to return. That’s not a bad thing either.
Keep in mind that there’s a lot of unavoidable noise in your new and returning visitors metric. It’s still valuable to pay attention to, especially if it changes drastically, but don’t let it be the only driver for major adjustments in your content strategy.
Referral Traffic
Most marketers think that measuring referral traffic will tell them how many backlinks there are for their website, but this metric has a lot more noise than that. Clicks that come from social media or from links in your email marketing campaign can all be marked as referral traffic by GA. Even clicks from one page of your website to another can. But there is something you can do about it.
Social media: Use a link shortener tool like bit.ly to add a tracking code to your links so you know where they came from.
Then under GA Admin, click “Social Settings” and add the URLs to your “Social Sources.” Then GA will know it’s not referral traffic.

Email marketing: Use GA’s URL Builder to create campaign tracking codes for links to your site that appear in emails. Then you can track which clicks are coming from emails.
Your website: Make sure that all the cross-linking on your website references the relative page (/page), not the full URL (www.site.com/page). The full address will be counted as referral traffic in GA, but the relative page will not.
Make what efforts you can to reduce the noise from non-referral traffic, but understand that you’ll never be able to completely clean up the statistic. At best, your referral traffic numbers will only be a vague proxy of the growth of your citations.
The Takeaway
GA is a valuable marketing tool, but it’s important to not take the data at face value. Here are some key points to remember about your metrics:
-
High bounce and exit rates aren’t always a bad thing.
-
Site speed and referral traffic have some limitations that you can fix.
-
Conversion rate by channel, average time on page, and new and returning visitors have some limitations that you can’t fix, yet.
The best thing you can do is consider the big picture with each metric, remember its limitations, and focus on how the data actually translates to user behavior. The only way to really know if the data reflects something good or bad is to consider your overall goals for the website, as well as the goals of specific pages within it.
 Courtney Danyel is a content marketing writer who provides unique and valuable content per audiences, based on the latest scientific and industry research. Visit her website to learn more about her work.
7 Google Analytics Metrics You’re Probably Doing Wrong 5.00/5 (100.00%) 1 vote
Related Posts


7 Google Analytics Metrics You’re Probably Doing Wrong
Google Analytics is a valuable tool that any marketer can use to optimize their content, website and overall campaigns, but there are still some pitfalls to the greatest free analytics tool on the web.
There are two main ways your GA data can actually mislead you:
(1) the metrics themselves have flaws and
(2) the way you think about the metric is flawed.
Here are 7 common metrics that you’re probably doing wrong.
Site Speed
Site speed is an important metric for optimizing user experience, however most marketers don’t have an accurate idea about their site’s speed because of the way it’s measured.
By default, GA measures site speed by sampling the loading time for 1% of your visitors. That’s a really small sample size, which increases the chances of outliers giving you inaccurate data. Luckily, you can fix this.
You can add a code in GA to increase your sample size to 100%. In the “Admin” section of your property, click “Tracking Info” and then “Tracking Code.” You’ll find a code like this:
Change the script to this:
ga(‘create’, ‘[YOUR GA ID]‘,{‘siteSpeedSampleRate’: 100});
Save your changes and you’re good to go!
Some metrics like site speed are designed with very high-traffic sites in mind. To avoid GA sampling too few of your visitors, it’s important to adjust these metrics to suit your unique needs.
Click To Tweet
Bounce Rate
Most marketers think a high bounce rate is always a negative thing — it means that someone came to your site, didn’t like what they saw, and left. But that’s not always or even often the case.
Have you ever read an interesting blog post, got something out of it, and then left the page? I do it about ten times a day. There’s nothing wrong with that kind of website interaction for the marketer, but GA tags it as a bounce.
That person who read your blog post then left could be heading over to follow you on social media, or return to become a longtime customer later on. While very high bounce rates overall is a sign of something negative, there is a certain amount of it that is acceptable.
So instead of stressing over the bounce rate of every page on your site, consider the purpose of the content, and how you might expect your audience to react to it. Sometimes, there’s nothing wrong with reading and then moving on.
Exit Rate
Like bounce rate, exit rate is another metric that marketers tend to think about only in the negative, when that’s not always the case. For example, a page with content that’s designed to convert, and does so effectively, would have a high exit rate. A page with a high SERP rank for long tail keywords would also have a higher exit rate than others. That doesn’t mean it wasn’t valuable.
That’s why it’s important to consider your intent and the search position of the page when deciding if a high exit rate is good or bad.
Conversion Rate by Channel
GA calculates conversion rate by acquisition channel based on the last non-direct click. That’s the best they can do to determine what influenced the conversion. But sometimes, users return to the site as direct traffic, which isn’t taken into consideration. Because of this, the metric often underestimates the actual conversion rate by different channels.
Considering multi-channel funnels and attribution modeling reports in addition to conversion rate by channel will give you a much clearer picture.
You can find the model explorer tool under Conversions>Attribution in the menu:
This sample attribution model from Optimize Smart shows the channels for organic search.
Average Time on Page
Many marketers take average time on page to mean how much time visitors are actively consuming content. But GA’s measurement gives the metric a completely different meaning.
Average time on page measures how long your web page is open in the user’s browser. However GA can’t tell if the visitor has multiple tabs open, and is perusing a site in one tab while yours is open in another.
After 30 minutes of not looking at your page, the analytics will “time out.” But still, looking through a few pages of your site for a minute and then leaving the tab open while surfing elsewhere is not a very accurate measurement of user behavior. On top of that, GA is unable to include how much time someone spent on the last page they visited, because another pageview doesn’t follow.
At this point, there’s not much you can do to improve the accuracy of this metric, so just keep in mind that it will almost always be an overestimation of actual behavior.
New and Returning Visitors
New and returning visitors can also be a very misleading metric. That’s because GA tracks returning users with cookies, so any return visitor who deleted their browser history would be considered a new visitor. Also people accessing the same website from different devices (laptop, mobile, tablet) and would be counted as a new visitor each time.
Many consider a low number of returning visitors to be bad for retention. That is valid, but it’s important to remember that a large number of those new visitors are probably not new at all. Also, it’s possible that your website is so well-targeted that users buy your product or service on the first visit, never to return. That’s not a bad thing either.
Keep in mind that there’s a lot of unavoidable noise in your new and returning visitors metric. It’s still valuable to pay attention to, especially if it changes drastically, but don’t let it be the only driver for major adjustments in your content strategy.
Click To Tweet
Referral Traffic
Most marketers think that measuring referral traffic will tell them how many backlinks there are for their website, but this metric has a lot more noise than that. Clicks that come from social media or from links in your email marketing campaign can all be marked as referral traffic by GA. Even clicks from one page of your website to another can. But there is something you can do about it.
Social media: Use a link shortener tool like bit.ly to add a tracking code to your links so you know where they came from.
Then under GA Admin, click “Social Settings” and add the URLs to your “Social Sources.” Then GA will know it’s not referral traffic.
Email marketing: Use GA’s URL Builder to create campaign tracking codes for links to your site that appear in emails. Then you can track which clicks are coming from emails.
Your website: Make sure that all the cross-linking on your website references the relative page (/page), not the full URL (www.site.com/page). The full address will be counted as referral traffic in GA, but the relative page will not.
Make what efforts you can to reduce the noise from non-referral traffic, but understand that you’ll never be able to completely clean up the statistic. At best, your referral traffic numbers will only be a vague proxy of the growth of your citations.
The Takeaway
GA is a valuable marketing tool, but it’s important to not take the data at face value. Here are some key points to remember about your metrics:
High bounce and exit rates aren’t always a bad thing.
Site speed and referral traffic have some limitations that you can fix.
Conversion rate by channel, average time on page, and new and returning visitors have some limitations that you can’t fix, yet.
The best thing you can do is consider the big picture with each metric, remember its limitations, and focus on how the data actually translates to user behavior. The only way to really know if the data reflects something good or bad is to consider your overall goals for the website, as well as the goals of specific pages within it.
Click To Tweet
Related Posts
Tags: