How and Where to Start Optimizing to Increase Your Conversion
Choosing the right place to start your optimization process is a super important decision. With so many conversion strategies and methods out there it’s hard to know where to start and how.

Where to start: It is customary to divide the user flow into Upper funnel (i.e banners, landing pages, lead generation) and lower funnel (registration forms and pricing pages etc.). When choosing the starting point of your test you need to take into account that the “lower” the point is in the funnel the less traffic you’ll have for the test.
To help you get started and locate where you need to start optimizing, we’ve listed 3 basic metrics you should be following as soon as possible. These metrics will help you decide where to start optimizing and how.
Bounce Rate
The bounce rate metric measures the amount of users who visit your site’s first page, and stop there. For example: if you have 10,000 visits a month to your site and 5000 users leave before doing anything else on your site, your bounce rate is 50%. If your visitors are leaving without taking any actions you may need to work on:
- Call to action buttons – One of the most important parts of conversion is creating the right call to action buttons. You can find 3 tips to improve your call to action buttons here.
- Messaging – Check your messaging. Using emotional conversion optimization can vastly improve your conversion optimization and get visitors to take the next step in your site. Check out these 3 emotional triggers to optimize your messaging.
From the screen capture below you can see our clients bounce rate throughout the course of a month. Once standing on over 60% bounce rate, has now changed to less than 10% by simply locating the leaks and addressing them.
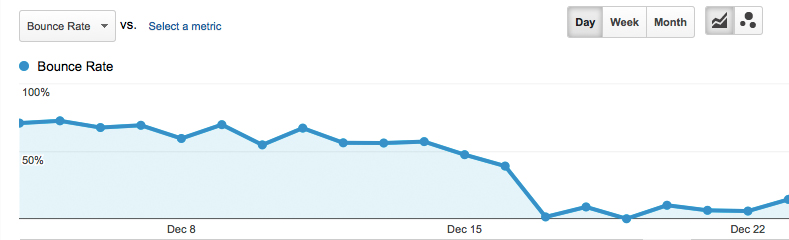
One important thing to remember is that bounce rate is a natural part of a website and some people just don’t find what they’re looking for or have found what they were looking for and don’t need to continue on, so you won’t be able to minimize it to 0% but you can reduce it a lot and learn from it. In many online campaigns even 95% bounce rate is good for certain media channels so it’s always good to compare this data versus any other traffic sources performance for a base line.
- Note that there is a difference between exit rate and bounce rate as Google explains here.
Funnel Visualization
Google analytics offers an option to follow your funnel and find the “leak”. Once you’ve set your goals on Google analytics the “Funnel visualization” option will be available. Following it will give you a lot of insight on the amount of visitors who have entered each part of the funnel, the amount of visitors who converted and their flow.
This is a wonderful tool to illustrate where is the most significant “leak” in your funnel, assisting you to take the right action in order to optimize it ( learn to avoid shopping cart abandonment).
For example, as you can see below, 50,516 visitors entered our client’s homepage, 52.56% clicked on the button to proceed. On the side you can see where users went to if they didn’t convert, like the pricing for example. This flow will help you understand where you need to optimize or where you can add conversion metrics.
Below we can see that many visitors end up on the pricing page instead of signing up, so we could add a call to action on the pricing page and increase conversion from there.
Technology
One metric you do not want to miss out on is the technology your visitors are using. On Google Analytics you will find (in the Audience category) the option to see which browsers your visitors are using, their version and whether they’re using mobile, desktop or tablets. Once you have this information you can:
- QA – Does your site work on all Chrome versions? Are you compatible to Safari? Run a string of tests on all browsers and make the corrections, do not lose customers because of bugs.
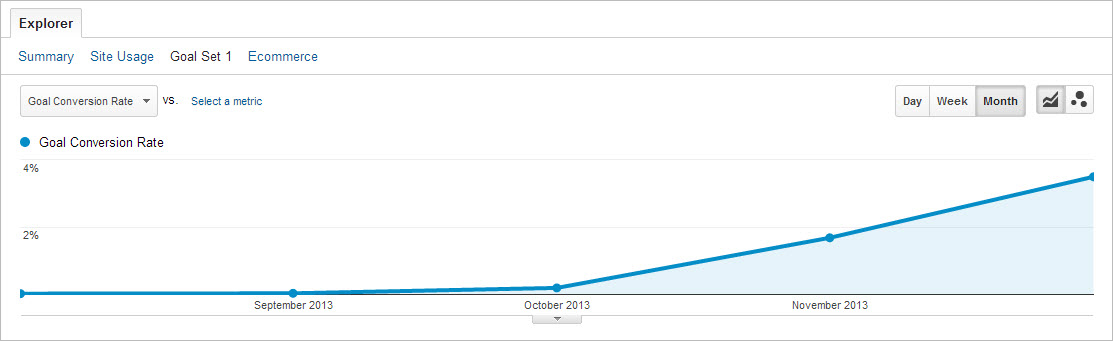
- True Story: In one of our recent tests we discovered that our client’s landing pages weren’t compatible with older versions of IE, which resulted in almost 0% conversion rate. This simple fix boosted their conversion rate by over 50%. Below you can see the difference from before we started optimizing and after, with over 250,000 visits via IE this was a massive optimization:
- Optimize: A new study shows that you could lose 40% of your visitors if your site isn’t mobile compatible. Is your site/product mobile responsive? Prepare yourself for your mobile traffic and do not lose it. A simple redirect to a mobile friendly page could save your conversion rate. Know your limitations and address them.
- Tip: To know which pages you need to optimize for mobile add a secondary dimension in Google Analytics (while in mobile overview) – “landing page”, and see where those mobile visitors are going, that way you won’t need to optimise your entire site to mobile immediately but fix it on the go.
Conversion optimization is an ongoing process that requires many conclusive tests and iterations. Testing too many variables at a time can cause a mess and testing the wrong variable can waste our time. Be sure to work out a test plan before starting out and use Google analytics to tackle the right areas.
What are the metrics you watch to help you decide where to optimize?
P.S. We would really appreciate it if you share this post and let us know what you think!


Pingback: Don't Let Your Google Analytics Data Get Polluted - 3 Things To Watch()