Setting up a website without proper tracking is the equivalent of being lost in the woods without knowing you’re in the woods. If we do not know where we stand how can we get to where we want to go? The following Google analytics guide will serve as a roadmap to avoiding common mistakes, ensure the proper tracking is in place, and provide a clear understanding of the key metrics that every marketer should be focused on.
Why is Google Analytics Important for Tracking?
Do you know how many unique visitors are coming to your site? What are the top pages they are viewing and how much time they are spending on each? Which channels are truly driving conversion? Google Analytics is a free tracking tool, provided by Google that can provide those answers. One of the most powerful analytics tools on the market, Google Analytics provides critical data to allow marketers to understand performance and derive data-driven actionable insights.
What makes Google Analytics so helpful?
- It integrates with other programs like AdSense and AdWords, adding additionally value if you are running any type of paid media campaigns.
- It’s relatively easy to implement and works on any type of website or blog
- There are built in reports and interfaces that provide enough information for beginners to analyze their site’s performance, but they also offer a wealth of functionality for more advanced users.
Setting Up Google Analytics:
Step 1: Signup for an account
Like all other Google products, you will need a Google Account in order to take advantage of Google Analytics. If you have a Google Mail account you can use the same ID, or you can create a new account. In either case you will need to visit the Google Analytics site to get started.
Step 2: Set up your account properties
There is a hierarchal relationship between accounts, properties, and users:
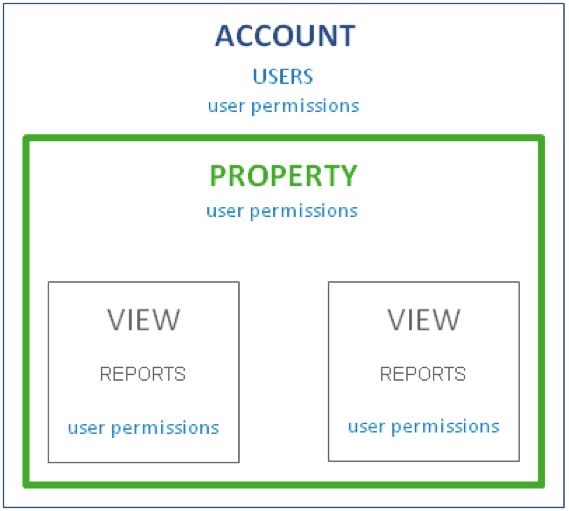
Account: This is your main access point for Google Analytics and is the top most level of organization
Property: An account can have multiple properties. Properties can be a website, mobile application, blog, etc.
View: This is where you go to access reports and can be customized for each property. Each property can contain one or more views and each view can contain multiple reports.
Users: You can add users to an account and then manage their permissions. Users can be assigned different permissions for each property or view level and the permissions govern what a user can see and what actions they can take within the account.
Step 3: Add the Tracking Code
Find the tracking code for your site: Click the Admin option from the top navigation. Use the Account and Property drop downs to select the property for which you want to generate the tracking code. Click on the Tracking Info/ Tracking Code option under the Property column.
Copy the tracking code snippet: You will see a box with several lines of code starting with <script> and ending with </script>. The tracking code contains a unique ID, also called a UA, which corresponds to a particular site. Copy everything in the box without making any edits.
Step 4: Add the snippet to your site
Paste the tracking code on every single page of the site. Any page that does not include the tracking code will not be tracked. The code should be placed right before the closing </head> tag in the HTML of the page.
Step 5: Verify your set up
Log back into Google Analytics and make sure that the site is capturing data. You can do this by going back to Admin from the top menu bar and clicking Tracking Info/ Tracking Code. At the top of the page it will tell you the status of the site’s tracking ability. There are four possible readings:
- Waiting for the data: The tracking code was detected on the home page of the site and Google’s servers are updating before data will appear in the report. If you see this status nothing else needs to be done.
- Tracking Not Installed or Not Verified: If you see this message it means the tracking code was not properly set up on your site. Make sure that you copied and pasted the full code and that it is included before the closing </head> tag.
- Tracking Installed: The tracking code is setup properly, collecting data, and sending data the report in Google Analytics. You are good to go!
- Unknown: There is no data available that Google Analytics can use to tell if the tracking code is setup. As stated above, check that the code was implemented correctly.
Most Common Mistakes When Tracking
1. I’ve added my GA tracking code, but no data is being collected
The Google Analytics tracking code should be copied and pasted directly from the GA admin console. Copying and pasting it to another program first like Microsoft Word or Outlook will insert additional characters that will cause the tracking code to function improperly once uploaded to your site.
2. Not all of my pages are tracking data
In many cases data can be tracked for the majority of a website, but certain sections may not contain any data. The GA tracking code needs to be present on every page of the site because only those pages that contain the tracking code will report data.
One way to check if the code is on each page of your site is to visit each individual page, right click for view source, then use CTRL +F to search for the tracking code or the UA. This can work for smaller sites, but for sites with many pages you can use a tool such as Screaming Frog to scan your site for the tracking code. Within Screaming Frog you can create a custom filter to pick up any pages that do not
3. My site has a really low bounce rate, so users must love it
In some cases a business may redesign a section of their website and see their bounce rate decrease significantly. For example, a drop in bounce rate from 60% to 5%. This may seem great, but it is worth considering possible causes for the drop, as a bounce rate under 15% is highly unlikely. The likely cause is that the analytics code has been duplicated on some pages, therefore when one of those pages are landed upon, the code is fired twice. If a user leaves straight away the bounce is not registered.
4. The misuse of filters
In certain cases you may want to use filters to exclude certain types of traffic from your analytics. Filters can be applied to manipulate the final data in reports; however having an incorrect filter can severely impact the accuracy and viability of reports. A good example is filtering out an office IP address to make sure those users are not counted in reporting. When creating ‘include and exclude’ filters it is important to think carefully about what is being included and excluded. Include filters act as “include only” and will only include the data specified. Carefully monitor any new filters once they are created and look for any major drop-offs or changes to the reporting.
5. Improper setup for sub-domains and multiple domains
Do users ever cross over to sub-domain, or to an entirely different domain during their journey? Tracking subdomains can be a more advanced topic, but is one of the more common mistakes that users make when setting up Google Analytics. Check out the Google help files for instructions on setting up your Google Analytics Tracking code to work with subdomains and multiple domains.
Top Metrics to Track for Conversion Optimization
In this Google analytics guide we’ve listed some of the most crucial metrics you should be following for understanding your funnel better and your leaks.
Google Analytics provides a wealth of data, but with limited time it is critical to prioritize the most important KPIs to analyze on a consistent basis:
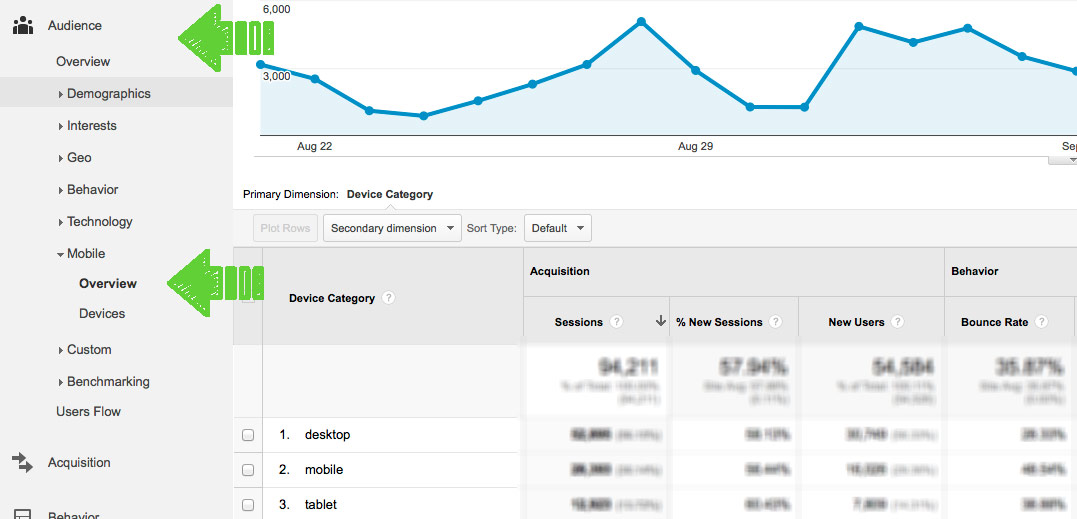
Device Segmentation – By 2015 it is expected that mobile search will outpace desktop search for the first time, and in some markets 40% to 50% of all traffic is from mobile. Understanding how traffic is performing at a device level is one of the most critical metrics to track. Large variances in metrics such as bounce rate, time on site, exit rate, and conversion can indicate device level issues impacting performance. Even more important, this metric can help define where you should start optimizing.From the left navigation, under Audience, select Mobile, and then Overview. This will bring up the default mobile dashboard, highlighting key metrics comparisons for Desktop, Mobile, and Tablet.
- Site Content – Underneath Behavior, from the left navigation, is an extremely helpful section known as Site Content. Site Content contains four sections: All Pages, Content Drilldown, Landing Pages, and Exit Pages. The All Pages view, as it is aptly named, shows all pages on the site. This gives a quick view of how all the pages of a site are performing, and which pages are being visited the most. The Content Drilldown report shows pages of a website grouped into their subfolders. The report rolls up performance of a particular section of the site to see how it is performing. This is an often overlooked, but extremely valuable report. The Landing Pages section highlights the top pages that users land on when reaching a site, sorted by default in order of sessions. The key metric to review here is bounce rate. A high bounce rate indicates that a landing page is not doing an effective job of transitioning a user to a site. The Exit Pages section shows the top pages that are causing visitors to leave a site. Focusing on those pages with the highest exit rates can remove leaks in the user journey to conversion.
- Channel Overview – One of the most important reports is the traffic and performance by channel. The channel overview report, found under the Audience tab in the left navigation, provides a wealth of information into how each channel is performing. The key metrics on the Channel report are Sessions and, if goal tracking is properly configured, conversions.
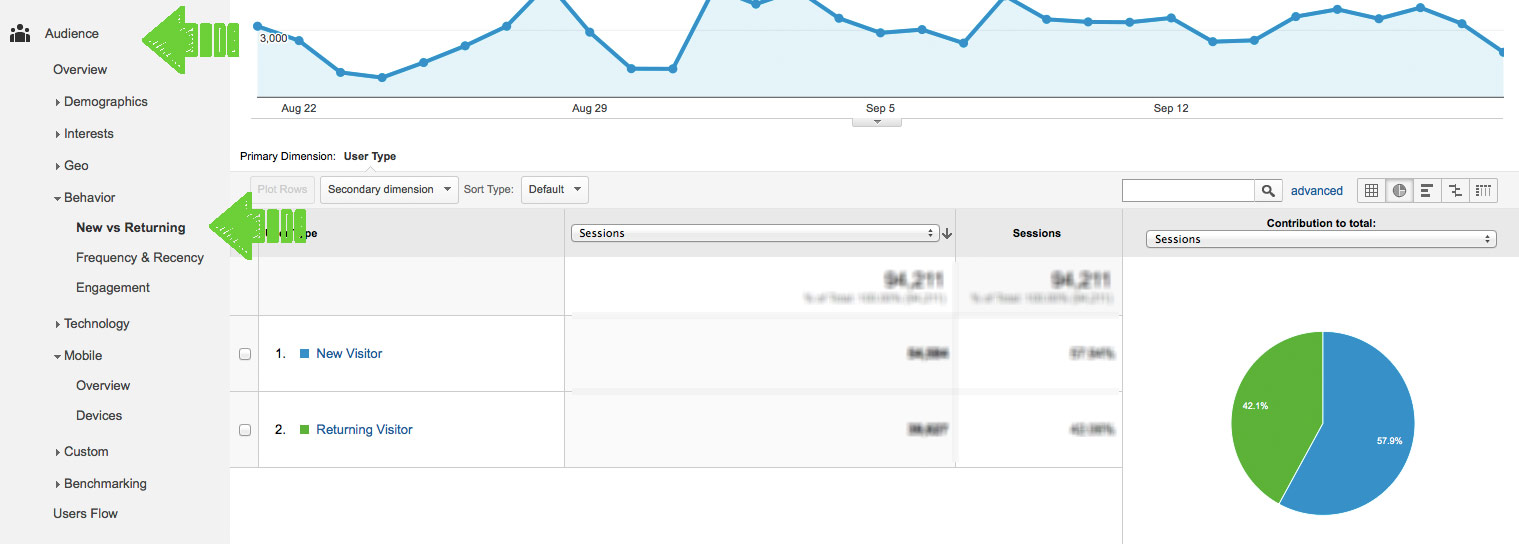
- New/Returning Visitors – The New vs. Returning visitor report in Google Analytics, found under Audience/Behavior, provides insight into how people who have been to a site before perform differently than first time visitors. This report will show you where you can make the biggest impact on the funnel. The report has two rows, New and Returning, for a quick view of how each bucket is performing. Clicking the pie chart icon on the top right of the table provides a great visualization of the proportion of new vs. returning visitors.
Google Analytics offers a wealth of data at no cost, is easy to setup, and provides good reporting to get started with. By installing Google Analytics and frequently reviewing the report, you can get a much clearer picture of how your site is performing and more importantly – where to start optimizing.
Google Analytics Guide: Where to Start and What to Track 4.71/5 (94.29%) 7 votes
Related Posts


Google Analytics Guide: Where to Start and What to Track
Setting up a website without proper tracking is the equivalent of being lost in the woods without knowing you’re in the woods. If we do not know where we stand how can we get to where we want to go? The following Google analytics guide will serve as a roadmap to avoiding common mistakes, ensure the proper tracking is in place, and provide a clear understanding of the key metrics that every marketer should be focused on.
Why is Google Analytics Important for Tracking?
Do you know how many unique visitors are coming to your site? What are the top pages they are viewing and how much time they are spending on each? Which channels are truly driving conversion? Google Analytics is a free tracking tool, provided by Google that can provide those answers. One of the most powerful analytics tools on the market, Google Analytics provides critical data to allow marketers to understand performance and derive data-driven actionable insights.
What makes Google Analytics so helpful?
Setting Up Google Analytics:
Step 1: Signup for an account
Like all other Google products, you will need a Google Account in order to take advantage of Google Analytics. If you have a Google Mail account you can use the same ID, or you can create a new account. In either case you will need to visit the Google Analytics site to get started.
Step 2: Set up your account properties
There is a hierarchal relationship between accounts, properties, and users:
Account: This is your main access point for Google Analytics and is the top most level of organization
Property: An account can have multiple properties. Properties can be a website, mobile application, blog, etc.
View: This is where you go to access reports and can be customized for each property. Each property can contain one or more views and each view can contain multiple reports.
Users: You can add users to an account and then manage their permissions. Users can be assigned different permissions for each property or view level and the permissions govern what a user can see and what actions they can take within the account.
Step 3: Add the Tracking Code
Find the tracking code for your site: Click the Admin option from the top navigation. Use the Account and Property drop downs to select the property for which you want to generate the tracking code. Click on the Tracking Info/ Tracking Code option under the Property column.
Copy the tracking code snippet: You will see a box with several lines of code starting with <script> and ending with </script>. The tracking code contains a unique ID, also called a UA, which corresponds to a particular site. Copy everything in the box without making any edits.
Step 4: Add the snippet to your site
Paste the tracking code on every single page of the site. Any page that does not include the tracking code will not be tracked. The code should be placed right before the closing </head> tag in the HTML of the page.
Step 5: Verify your set up
Log back into Google Analytics and make sure that the site is capturing data. You can do this by going back to Admin from the top menu bar and clicking Tracking Info/ Tracking Code. At the top of the page it will tell you the status of the site’s tracking ability. There are four possible readings:
Most Common Mistakes When Tracking
1. I’ve added my GA tracking code, but no data is being collected
The Google Analytics tracking code should be copied and pasted directly from the GA admin console. Copying and pasting it to another program first like Microsoft Word or Outlook will insert additional characters that will cause the tracking code to function improperly once uploaded to your site.
2. Not all of my pages are tracking data
In many cases data can be tracked for the majority of a website, but certain sections may not contain any data. The GA tracking code needs to be present on every page of the site because only those pages that contain the tracking code will report data.
One way to check if the code is on each page of your site is to visit each individual page, right click for view source, then use CTRL +F to search for the tracking code or the UA. This can work for smaller sites, but for sites with many pages you can use a tool such as Screaming Frog to scan your site for the tracking code. Within Screaming Frog you can create a custom filter to pick up any pages that do not
3. My site has a really low bounce rate, so users must love it
In some cases a business may redesign a section of their website and see their bounce rate decrease significantly. For example, a drop in bounce rate from 60% to 5%. This may seem great, but it is worth considering possible causes for the drop, as a bounce rate under 15% is highly unlikely. The likely cause is that the analytics code has been duplicated on some pages, therefore when one of those pages are landed upon, the code is fired twice. If a user leaves straight away the bounce is not registered.
4. The misuse of filters
In certain cases you may want to use filters to exclude certain types of traffic from your analytics. Filters can be applied to manipulate the final data in reports; however having an incorrect filter can severely impact the accuracy and viability of reports. A good example is filtering out an office IP address to make sure those users are not counted in reporting. When creating ‘include and exclude’ filters it is important to think carefully about what is being included and excluded. Include filters act as “include only” and will only include the data specified. Carefully monitor any new filters once they are created and look for any major drop-offs or changes to the reporting.
5. Improper setup for sub-domains and multiple domains
Do users ever cross over to sub-domain, or to an entirely different domain during their journey? Tracking subdomains can be a more advanced topic, but is one of the more common mistakes that users make when setting up Google Analytics. Check out the Google help files for instructions on setting up your Google Analytics Tracking code to work with subdomains and multiple domains.
Top Metrics to Track for Conversion Optimization
In this Google analytics guide we’ve listed some of the most crucial metrics you should be following for understanding your funnel better and your leaks.
Google Analytics provides a wealth of data, but with limited time it is critical to prioritize the most important KPIs to analyze on a consistent basis:
Device Segmentation – By 2015 it is expected that mobile search will outpace desktop search for the first time, and in some markets 40% to 50% of all traffic is from mobile. Understanding how traffic is performing at a device level is one of the most critical metrics to track. Large variances in metrics such as bounce rate, time on site, exit rate, and conversion can indicate device level issues impacting performance. Even more important, this metric can help define where you should start optimizing.From the left navigation, under Audience, select Mobile, and then Overview. This will bring up the default mobile dashboard, highlighting key metrics comparisons for Desktop, Mobile, and Tablet.
Google Analytics offers a wealth of data at no cost, is easy to setup, and provides good reporting to get started with. By installing Google Analytics and frequently reviewing the report, you can get a much clearer picture of how your site is performing and more importantly – where to start optimizing.
Related Posts
Tags: